Performance audit of an Italian news website
News websites have a lot of text, images and other media, and they often rely on many third party scripts for ads and analytics. This huge amount of assets means that the number of HTTP requests on these websites can be quite high. The browser might take a while to process all of these requests and execute JavaScript, and performance can suffer.
Users spend less time consuming content on a slow website. This can have a negative impact on revenue, in particular for news websites. Google’s DoubleClick reports that publishers whose mobile sites load in 5 seconds earn up to 2x more mobile ad revenue than sites loading in 19 seconds.
In this article I’ll describe what I found out about the digital version of Il Tirreno, an Italian newspaper that covers news about Tuscany. I’ll analyze both data collected from the real users visiting the website, and data collected in a controlled environment under a predefined set of network and device conditions.
Il Tirreno has 14 different editions, and eight out of the ten provinces in Tuscany have at least one edition of this newspaper. Since I live in Versilia, I decided to focus my analysis on the web page https://www.iltirreno.it/versilia. This means that all my findings and suggestions are related to that page. The structure of the local news front page stays the same across all 14 local editions of iltirreno.it though, so most conclusions should hold for pages like https://www.iltirreno.it/lucca or https://www.iltirreno.it/pisa.
Real user metrics
The Chrome User Experience Report (CrUX) provides metrics for how real-world Chrome users experience websites that are sufficiently popular. These metrics are collected from Android and desktop users that have Chrome as their browser. In other words, in CrUX we won’t find any data originated from iOS devices or any browser other than Chrome.
These data are aggregated by origin and collected each month. The following month, these data are then ingested into BigQuery.
The CrUX dataset
Il Tirreno is a popular newspaper in Tuscany, and its digital edition Iltirreno.it has enough traffic to end up in CrUX.
The CrUX BigQuery dataset is publicly available, but in order to explore it you will need a Google Cloud Platform project and some knowledge of SQL. I’ll share links for the queries I ran, so you can try them out yourself if you want.
⚠️ — The CrUX dataset is huge, so be careful when writing queries against it. With BigQuery on-demand pricing you can query up to 1TB worth of data per month for free. If you exceed that quota you'll have to pay $5/TB. To avoid unforeseen expenses with BigQuery, always have a look at how much data a query would process before running it.
Traffic by device
First of all, I wanted to know what was the percentage of phone, tablet and desktop traffic on any page of www.iltirreno.it. CrUX contains data from 2017 onwards, but I didn’t want to process too much data (i.e. spend money for this query), so I restricted the analysis to the month of January 2023.
Unsurprisingly, www.iltirreno.it is most popular in Italy. Somewhat surprisingly (at least for me), almost 90% of the Italian traffic in January 2023 came from phones.
| Country | Popularity | Desktop | Phone | Tablet |
|---|---|---|---|---|
| Italy | 1000 | 9.0 | 89.0 | 3.0 |
| San Marino | 5000 | 0.0 | 100.0 | 0.0 |
| Albania | 10000 | 0.0 | 100.0 | 0.0 |
Here is the query. Try it out!
Traffic by effective connectivity
The effective connectivity for the majority of those visits was 4G.
| Country | 3G | 4G |
|---|---|---|
| Italy | 5.0 | 95.0 |
Here is the query. Try it out!
Performance over time
I wanted to know whether the performance changed over the course of 3 months. The metrics I decided to extract from CrUX are:
- Time To First Byte (TTFB)
- First Contentful Paint (FCP)
- The browser’s Window load event
Here is why I decided to pick these metrics:
- TTFB. This is the time between the browser’s request and the first byte of response received from the server. A long TTFB suggests there is some issue on the backend, which could be caused by many factors: a slow webserver, too much requests hitting the server, slow database queries, network congestion. On the other hand, if TTFB is really short (good) but perfomance is still not great, it could be a sign that there is some issue on the frontend.
- FCP. This is the time from when the page starts loading to when any part of the page’s content is rendered on the screen. More precisely, when we say content we mean any text, image (including background images), non-white
<canvas>elements or SVG. The content which is first rendered might not be the biggest one which ends on the screen. For that there is another metric called Largest Contentful Paint (LCP). I decided to pick FCP instead of LCP because I noticed that the biggest content on iltirreno.it/versilia is often an ad, not some image of the website itself. loadevent. The browser fires this event when it has finished loading the page and all of its dependent resources: stylesheets, scripts, images, iframes. This event is important because if the browser takes a long time to fire it, it means it has still some work to do, even if we see a visually completed page.
In the tables below, TTFB good/avg/bad is expressed in percentage of users that experienced that metric in that particular way. The same applies to FCP and the load event. Instead, p75 represents the 75th percentile of that metric and it is expressed in milliseconds.
| yyyymmdd | TTFB good | TTFB avg | TTFB bad | TTFB p75 |
|---|---|---|---|---|
| 20230101 | 57.24 | 26.72 | 16.0 | 1300 |
| 20221201 | 50.89 | 30.13 | 18.92 | 1500 |
| 20221101 | 45.59 | 33.34 | 21.04 | 1600 |
| yyyymmdd | FCP good | FCP avg | FCP bad | FCP p75 |
|---|---|---|---|---|
| 20230101 | 72.47 | 17.09 | 10.41 | 1900 |
| 20221201 | 68.03 | 19.75 | 12.16 | 2100 |
| 20221101 | 66.28 | 20.88 | 12.85 | 2100 |
| yyyymmdd | load good | load avg | load bad | load p75 |
|---|---|---|---|---|
| 20230101 | 8.71 | 40.55 | 50.7 | 10400 |
| 20221201 | 9.16 | 43.33 | 47.47 | 9500 |
| 20221101 | 10.92 | 46.62 | 42.42 | 8700 |
Here is the query. Try it out!
Comparison with other news websites
We can also compare Il Tirreno to other local newspapers:
- La Nazione, which has the highest print circulation in Tuscany (~1.85 times the one of Il Tirreno).
- La Nuova Sardegna, which is roughly as popular in Sardinia as Il Tirreno is in Tuscany.
ℹ️ — Il Tirreno and La Nuova Sardegna are published by the same editorial group. If we have a look at their websites, we see they have a similar layout and probably share some components of their tech stack. Notice how the TTFB is not too dissimilar between the two websites (see tables below).
The majority of the traffic to these news websites comes from phones using a 4G connection. Desktop traffic is only 10-15%. Tablet traffic is negligible.
| yyyymmdd | Domain | Phone | Desktop | Tablet | 3G | 4G |
|---|---|---|---|---|---|---|
| 20230101 | iltirreno.it | 88.56 | 8.57 | 2.84 | 4.9 | 95.07 |
| 20230101 | lanazione.it | 87.2 | 9.87 | 2.9 | 4.78 | 95.19 |
| 20230101 | lanuovasardegna.it | 87.31 | 9.34 | 3.35 | 4.81 | 95.19 |
| 20221201 | iltirreno.it | 85.36 | 11.38 | 3.2 | 4.74 | 95.2 |
| 20221201 | lanazione.it | 88.57 | 8.54 | 2.85 | 4.91 | 95.05 |
| 20221201 | lanuovasardegna.it | 86.46 | 9.9 | 3.64 | 5.0 | 95.0 |
| 20221101 | iltirreno.it | 79.84 | 16.24 | 3.93 | 4.2 | 95.81 |
| 20221101 | lanazione.it | 85.49 | 11.6 | 2.85 | 4.66 | 95.28 |
| 20221101 | lanuovasardegna.it | 87.09 | 9.66 | 3.23 | 5.17 | 94.81 |
iltirreno.it and lanuovasardegna.it have a similar TTFB. These newspapers are published by the same publisher, so I guessed their websites have a similar codebase and maybe share the same infrastructure. The TTFB of lanazione.it is 2-3 better than the other two.
| yyyymmdd | Domain | TTFB good | TTFB avg | TTFB bad | TTFB p75 |
|---|---|---|---|---|---|
| 20230101 | iltirreno.it | 57.24 | 26.72 | 16.0 | 1300 |
| 20230101 | lanazione.it | 87.27 | 9.49 | 3.21 | 400 |
| 20230101 | lanuovasardegna.it | 57.18 | 29.72 | 13.0 | 1200 |
| 20221201 | iltirreno.it | 50.89 | 30.13 | 18.92 | 1500 |
| 20221201 | lanazione.it | 88.22 | 8.79 | 2.98 | 400 |
| 20221201 | lanuovasardegna.it | 54.88 | 30.27 | 14.73 | 1300 |
| 20221101 | iltirreno.it | 45.59 | 33.34 | 21.04 | 1600 |
| 20221101 | lanazione.it | 85.35 | 10.57 | 4.05 | 500 |
| 20221101 | lanuovasardegna.it | 54.92 | 31.03 | 13.99 | 1200 |
The load event shows less variation across the three newspapers. It is quite high, probably because of ads and other third party scripts.
| yyyymmdd | Domain | load good | load avg | load bad | load |
|---|---|---|---|---|---|
| 20230101 | iltirreno.it | 8.71 | 40.55 | 50.7 | 10400 |
| 20230101 | lanazione.it | 13.08 | 32.53 | 54.38 | 12900 |
| 20230101 | lanuovasardegna.it | 8.93 | 36.53 | 54.49 | 11400 |
| 20221201 | iltirreno.it | 9.16 | 43.33 | 47.47 | 9500 |
| 20221201 | lanazione.it | 14.87 | 34.37 | 50.78 | 12200 |
| 20221201 | lanuovasardegna.it | 9.14 | 38.91 | 51.9 | 10900 |
| 20221101 | iltirreno.it | 10.92 | 46.62 | 42.42 | 8700 |
| 20221101 | lanazione.it | 19.34 | 34.34 | 46.33 | 11300 |
| 20221101 | lanuovasardegna.it | 9.3 | 40.9 | 49.81 | 10300 |
Cumulative Layout Shift sits at around 70% for everyone. This means there aren’t too many layout shifts in any of these websites.
| yyyymmdd | Domain | CLS good | CLS avg | CLS bad |
|---|---|---|---|---|
| 20230101 | iltirreno.it | 72.18 | 16.48 | 11.34 |
| 20230101 | lanazione.it | 73.04 | 18.08 | 8.89 |
| 20230101 | lanuovasardegna.it | 70.39 | 16.62 | 12.96 |
| 20221201 | iltirreno.it | 73.17 | 15.98 | 10.85 |
| 20221201 | lanazione.it | 70.66 | 19.42 | 9.93 |
| 20221201 | lanuovasardegna.it | 67.22 | 18.63 | 14.17 |
| 20221101 | iltirreno.it | 73.05 | 17.67 | 9.28 |
| 20221101 | lanazione.it | 70.21 | 18.45 | 11.31 |
| 20221101 | lanuovasardegna.it | 68.24 | 17.36 | 14.42 |
Here is the query. Try it out!
WebPageTest
💡 — This part of the article introduces WebPageTest and briefly describes its main sections. If you already know WebPageTest, you can probably skip this section.
We know that most visits to iltirreno.it during the month of January 2023 came from phones using a 4G connection.
The CrUX dataset provides us with performance metrics about those visits. In other words, it tells us how much a website is fast/slow overall.
However, CrUX doesn’t tell us why the website is fast/slow. In order to answer that question, we need to know:
- How many HTTP requests are made by the browser.
- Which HTTP requests are problematic for web performance.
- Which resources are cached, and for how long.
- How much HTML, CSS, JS is on a given page.
- How much time the main thread spends executing JS.
- Which fonts are used, what’s their file format, how they are served.
- How many images, audios, videos are on a page, where they are hosted, how big they are.
The best tool to give us all this information is WebPageTest.
Launching an audit
WebPageTest lets us choose the location and browser we want to use to test a website.
Since we saw from CrUX that the majority of visits to iltirreno.it came from Italy and from phones, we pick Milan as the test location, and Chrome running on a low-mid tier phone as the browser.
In several articles about web performance, Moto G4 is often picked to run a performance audit. I argue that nowadays most users—or at least, most of the visitors of iltirreno.it—have a more powerful device. So I chose a Google Pixel 2 XL for this test (here is a comparison between Moto G4, Google Pixel 2 XL, and my current smartphone).
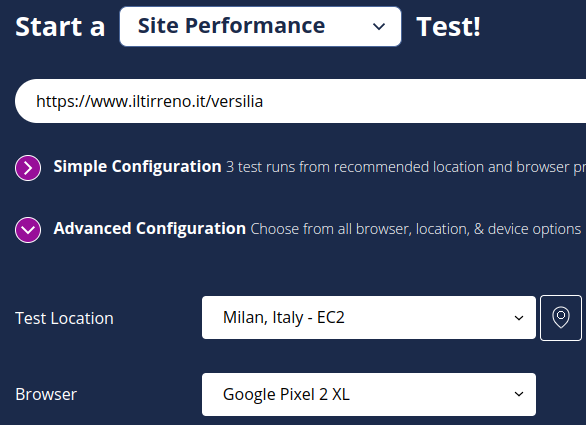
As we can see from the word EC2, the test doesn’t really run on the Google Pixel 2 XL, but on an AWS EC2 instance. The phone is emulated by throttling the CPU of the EC2 instance (by a factor of 4, see here) and its connectivity (see here).
It’s always a good idea to perform multiple runs (here 3, but the more the better), and to test the website both as a first-time visitor (First View) and as a repeat visitor (Repeat View). This way we can evaluate the effect of caching on the website’s performance. We can also assign a label to each test. This is particularly useful when we need to compare the results from two different tests.
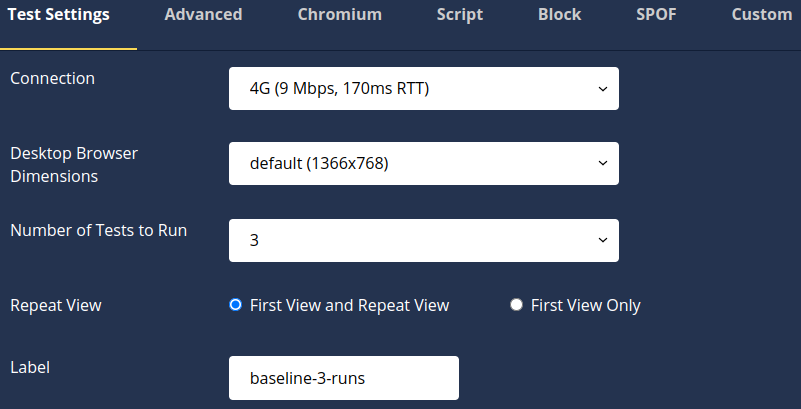
There are other tabs as we can see from the screenshot above. We’ll talk about them later.
Navigating the test result
A WebPageTest test result contains many sections, dropdown menus, views, charts. It can be quite an intimidating experience for new users. The interface improved a lot in the last few months, but the problem is that assessing web performance requires a lot of information, so any web performance tool has to give us a lot of data to analyze.
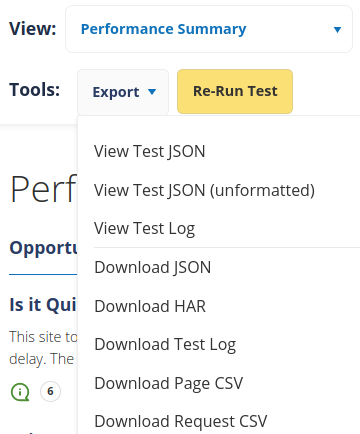
I think the best way to start analyzing a WebPageTest test result is by selecting Performance Summary in the View dropdown. Here we can find a quick overview of a website’s performance, and links to pages that focus on individual details. We can also export the results of the test. For example, we can download the HAR file to analyze the HTTP requests using other tools.
One of the first sections we see in Performance Summary is Real User Measurements. This contains data returned from CrUX. I think WebPageTest calls the CrUX API, which might not return the exact same data of the queries I ran against the CrUX BigQuery dataset. This would explain why the numbers are slightly different.
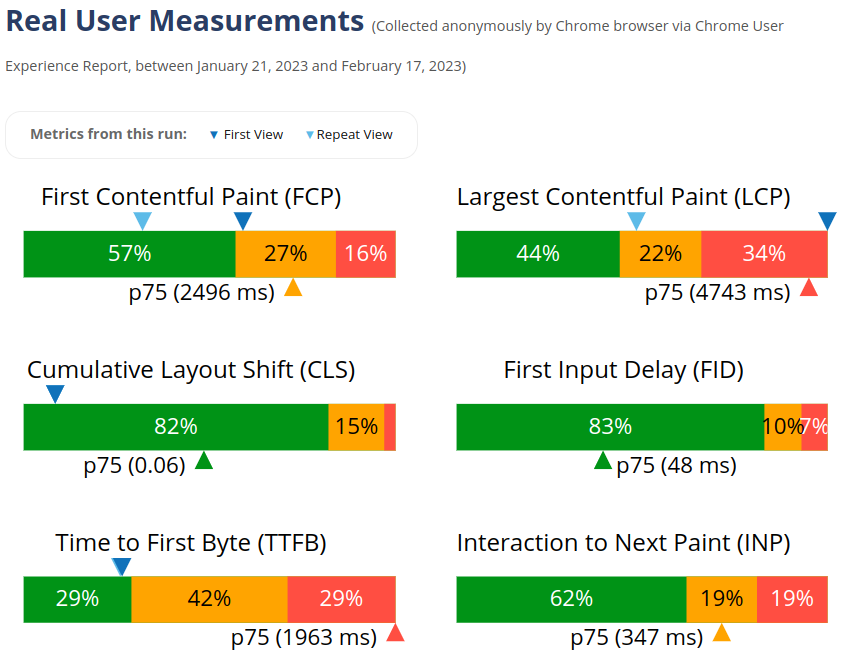
From the CrUX screenshot we can see that both FCP and LCP improve for repeat visits (light blue triangle). This suggests that some resources are cached. We’ll see later which ones.
The Individual Runs section contains the Waterfall, a chart visualizing all HTTP requests that the browser made when navigating to the URL we choose to test.
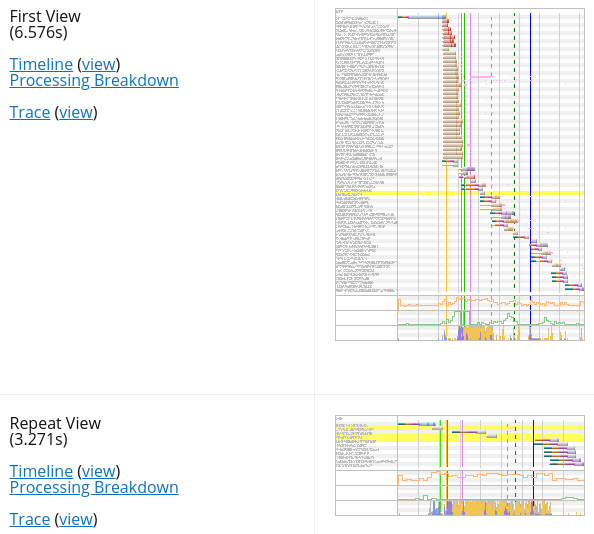
In fact, there are several waterfall charts. Two for each run, given that we checked First View and Repeat View when we launched the test.
The waterfall charts here are just thumbnails. But if we click on one of them, WebPageTest takes us to the Details section. There we can interact with the Waterfall View of that particular test run and first/repeat view.
Next to each waterfall thumbnail we find a screenshot that WebPageTest took at the end of that particular test run. Then, next to the screenshot, two links, one to the Filmstrip View, another one to a video that shows how the browser loaded the page during the test run.

Video and Filmstrip View
Let’s start from the video and recap what it shows. It’s the experience that a user has when visiting iltirreno.it/versilia for the first time, using a Google Pixel 2 XL, on a 4G connection from Milan.
💡 — This is a video, not a GIF. You should never use a GIF for an animated clip.
The Filmstrip View shows a few frames of the video, and can be configured to highlight the Largest Contentful Paint (LCP) and any layout shifts.
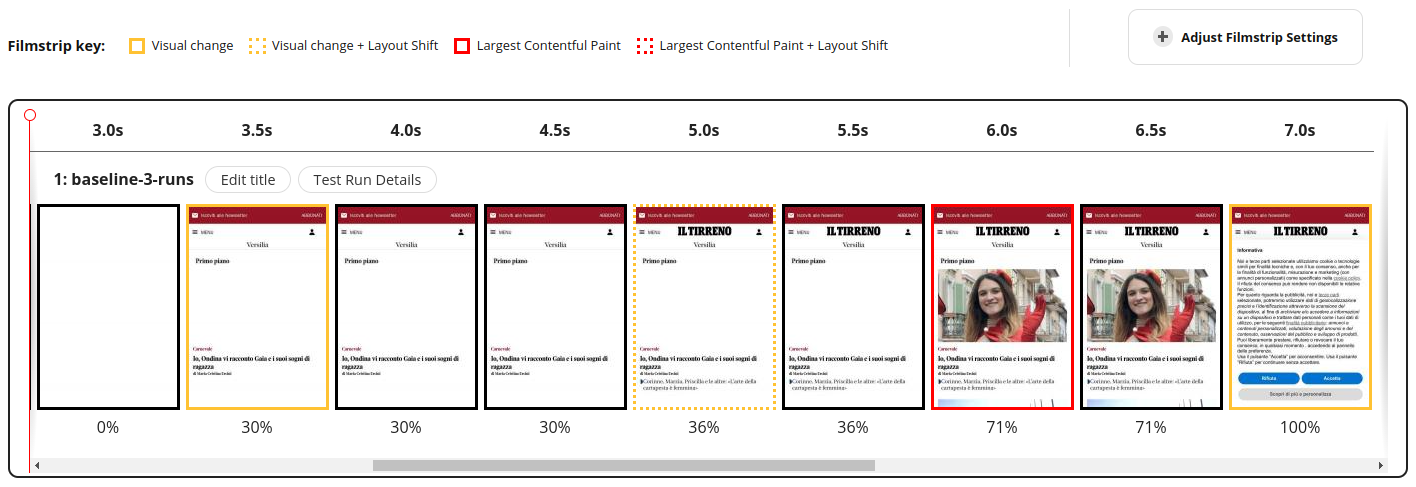
Even just by watching the video, we can start asking ourselves a few questions and formulating a few hypotheses:
- The page takes roughly 3.5 seconds to show any content. Remember, we are testing on a 4G connection from Milan, so this time seems a bit high for just a few lines of text and two images (one of which barely appears at the bottom of the viewport).
- There are two text elements that are not immediately visible. The title of the newspaper (IL TIRRENO) and the subtitle of the only article that appears in the viewport (Corinne, Marzia, Priscilla…). Could this be a case of Flash Of Invisible Text (FOIT)?
- The images do not cause any layout shift. This is good. Layout shifts are bad for user experience.
- An annoying consent banner appears and covers almost the entire viewport. This is expected. In order to comply with the 2002 ePrivacy Directive, any website that collects personal data from the user must obtain their explicit consent. We’ll spend a few words about consent banners, since they can be problematic when assessing the performance of a website.
ℹ️ — The ePrivacy Directive is often called EU Cookie Law. This, from a technical standpoint, is a bit imprecise. This EU directive cites browser cookies as an example, but it applies to all ways that a website—or any of its third party scripts—can use to track a user. For example, if a website tracks its users' behavior using Local Storage or IndexedDB, it still must obtain their explicit consent.
Detected Technologies
We could now open Chrome DevTools, have a look at the Element panel and the Sources panel, and try to understand the tech stack behind this website. But WebPageTest has a Detected Technologies section that saves us a bit of time. It’s not always accurate and can be a bit misleading at times (even when it says Detection confidence 100), so it’s always a good idea to verify these findings in the Waterfall View.
WebPageTest detected that this website is built with Next.js, served by Nginx, and cached on AWS CloudFront.
It also detected Webpack, React, Material UI, Emotion, Lodash, core-js.
Finally, it detected these services:
- Iubenda
- Google Analytics
- Google Publisher Tag
- Google Tag Manager
ℹ️ — Iubenda is a service that deals with legal obligations. It generates cookie policies, privacy policies, terms of service, etc.
News websites make money by selling advertising space. So it’s no surprise that there are snippets for ads and trackers on this website. However, these third party scripts needs to be downloaded, parsed and executed. They can be detrimental to performance if they are too many.
Breakdown by domains
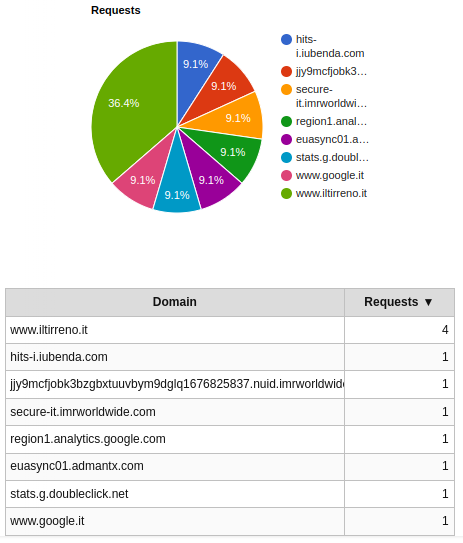
WebPageTest has a section called Domains that shows us the requests breakdown, by domain. Down below we can see the number of requests on a first visit. I clipped the table to show only the first 5 domains by number of requests.
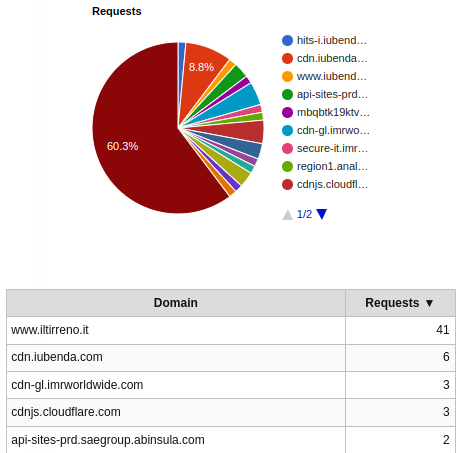
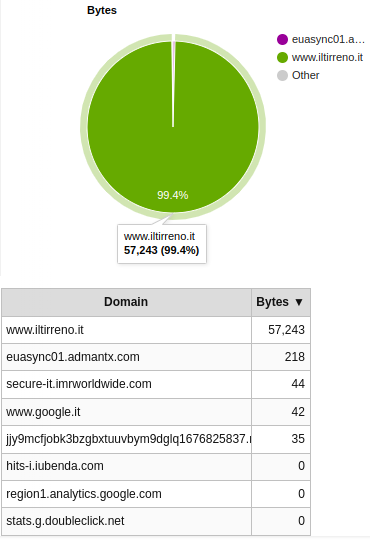
In the same section we can also see the amount of bytes fetched, by domain. This pie chart tells us that, on a first visit, a bit more than 40% of the bytes come from domains other than www.iltirreno.it. Again, I clipped the table to show only the first 5 domains by number of bytes fetched.
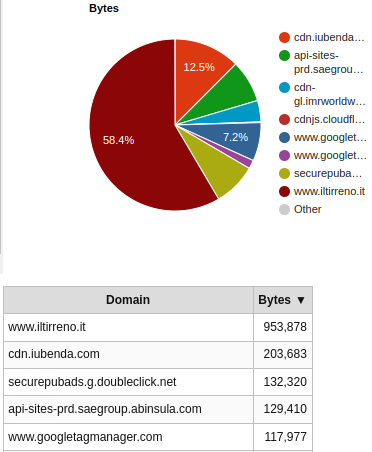
The situation improves on a repeat visit. The browser now makes only 11 requests.
The amout of bytes downloaded is also significantly reduced and comes almost entirely from www.iltirreno.it.
Breakdown by MIME type
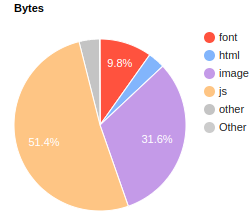
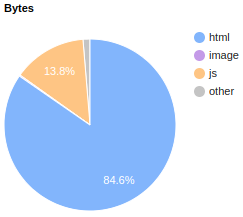
A section of WebPageTest that can be quite revealing at times—and it is in this case—is the Content section, which breaks down requests and bytes by MIME type. Here I focus on the bytes, since they offer us a clear picture of what’s going on.
Here are the bytes downloaded on a first visit.
And here are the bytes downloaded on a repeat visit.
We can draw the following conclusions by looking at these two pie charts:
- A lot of JS is downloaded on a first visit. I find this a bit odd, since this website is built with Next.js, which can render pages on the server at runtime (server-side rendering) or even pre-render them at build time (static generation). I would have expected to see more HTML and CSS.
- Images and fonts images represent a significant share of the pie. This could be perfectly fine, it’s a news website after all. It’s reasonable to expect a lot of images and maybe some custom fonts.
- Almost only HTML is downloaded on a repeat visit. This is not surprising. HTML is rarely cached (or if it is, not for much long), while immutable assets such as fonts and images are usually cached for a long time. The browser downloaded them on the first visit, so it doesn’t need to download them again on subsequent visits.
Waterfall View
Until now, all sections of WebPageTest have been quite straightforward to discuss. The Details section is a whole different beast though, since it contains the Waterfall View.
The Waterfall View is without a doubt the most difficult visualization to understand in a WebPageTest test result. But arguably the most important to analyze. It contains:
- On the left, the complete list of HTTP requests made by the browser when loading the website.
- On the right, the timeline of all HTTP requests. Each request is represented by a horizontal bar. Each bar is colored according to the type of resource this HTTP request is made for (HTML in blue, CSS in green, font in red, etc).
- At the bottom, two stepped line graphs for CPU Utilization and Bandwidth In, and two other charts for the Browser Main Thread and Long Tasks.
- At the top, a legend that encodes the meaning of each color and icon used in the waterfall.
Down below we can see the Waterfall View of iltirreno.it/versilia on a first visit, for the second run of the WebPageTest audit. I decided to show only the first and last ten HTTP requests to make it easier to comprehend. I blurred out all other requests in between.
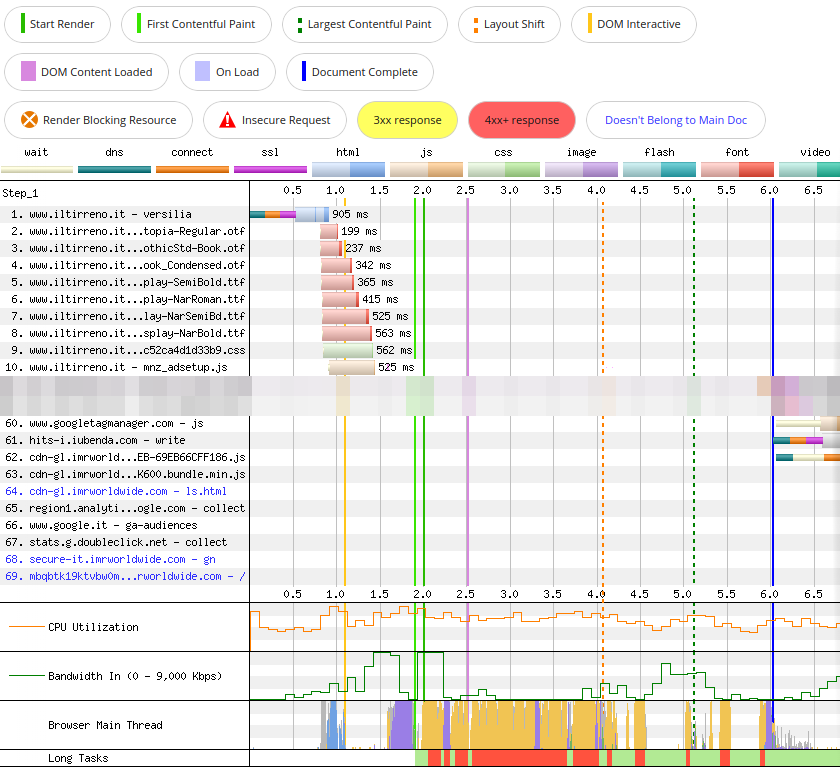
Throughout the rest of this article I will describe a few characteristics of iltirreno.it/versilia by pointing them out in the waterfall. I will show only a few HTTP requests at a time, to avoid overwhelming you with too much information.
If you find yourself struggling making sense of this chart, definitely take a pause from reading this article and go study Matt Hobbs’ magnum opus How to read a WebPageTest Waterfall View chart. Also, the knowledge you might gain from reading my article is limited to the characteristics of iltirreno.it/versilia, while Matt’s article covers many more scenarios and web performance issues.
HTML, CSS, JS
The first request made when visiting iltirreno.it/versilia is for its HTML document. This file is hosted on the domain www.iltirreno.it.
Since this is the first resource requested, the browser has to first perform a DNS lookup, establish an HTTP connection, complete a TLS handshake (aka SSL negotiation).
Then it can finally request the HTML and download it.
Down below we can see the request details on a first visit, on the second run of the WebPageTest audit.
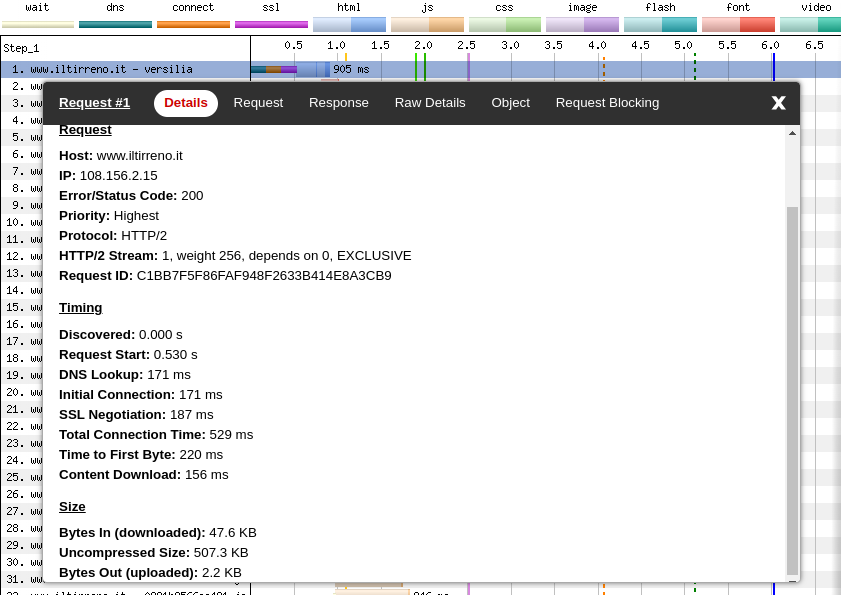
Cache-Control for the HTML document
Down here we can see the request response (still for a first visit, on the second run of the WebPageTest audit).
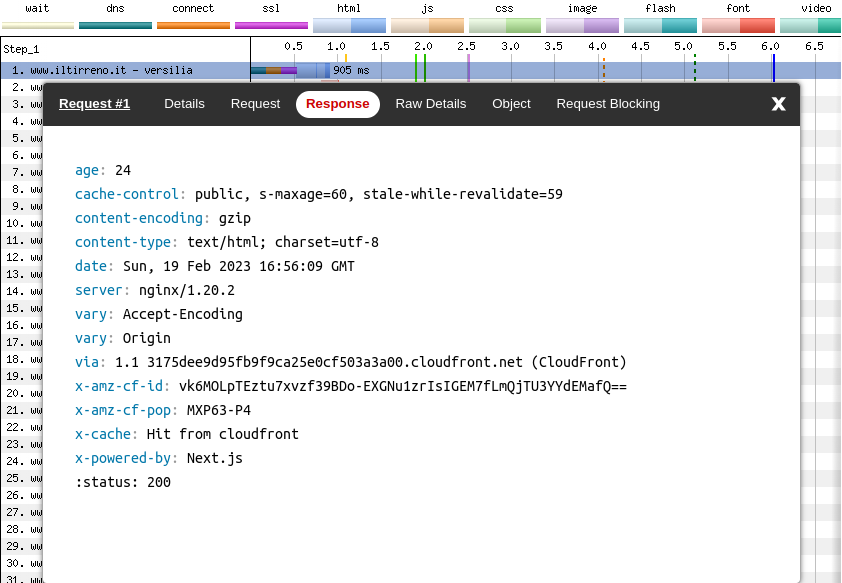
Why did I pick the second run and not the first one? Because it shows that the HTML, even on a first visit, it is served from a cache. To be more precise, this HTML file was cached 24 seconds ago on the AWS CloudFront CDN:
age: 24
x-cache: Hit from cloudfront
A CDN acts as a shared cache, so a file that is requested by one user can be accessed later by other users. In this performance audit a “user” is any one of the WebPageTest test runs. The HTML document is cached on AWS CloudFront after the first run, so the second run was able to download it from the CDN without requesting it from the origin server (Nginx in this case).
We can verify this by looking at the HTTP response headers sent on the first run.
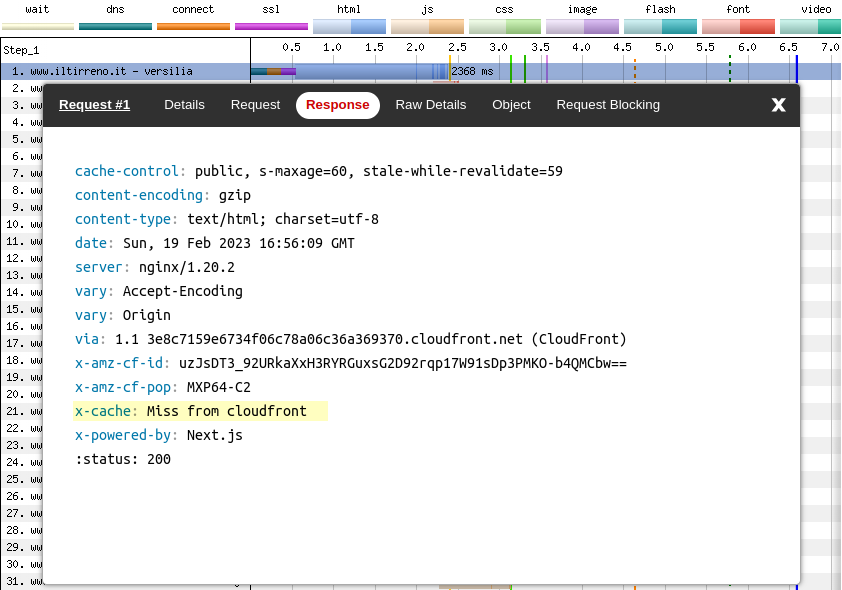
That x-cache: Miss from cloudfront tells us that on a first visit, on the first run, the browser had to:
- Do DNS lookup + HTTP connection + TLS handshake (as during a first visit, on the second run)
- Look for the HTML in CloudFront and fail to find it
- Request the HTML from Nginx
- Wait for Nginx to pass the request to a Node.js server
- Wait for the Node.js server to server-side render the (dynamic) HTML with Next.js
💡 — A nice tool for analyzing HTTP response headers is REDbot.
We can clearly see that during a first visit, on the first run, the DNS lookup, HTTP connection, TLS handshake take roughly the same amount of time than during a first visit, on the second run. The additional steps that the browser has to perform during the first run add ~1200ms to the Time To First Byte (TTFB).
On the first run, the whole process (the combined length of the teal, orange, magenta, blue bars) takes 2368ms instead of the 905ms of the second run.
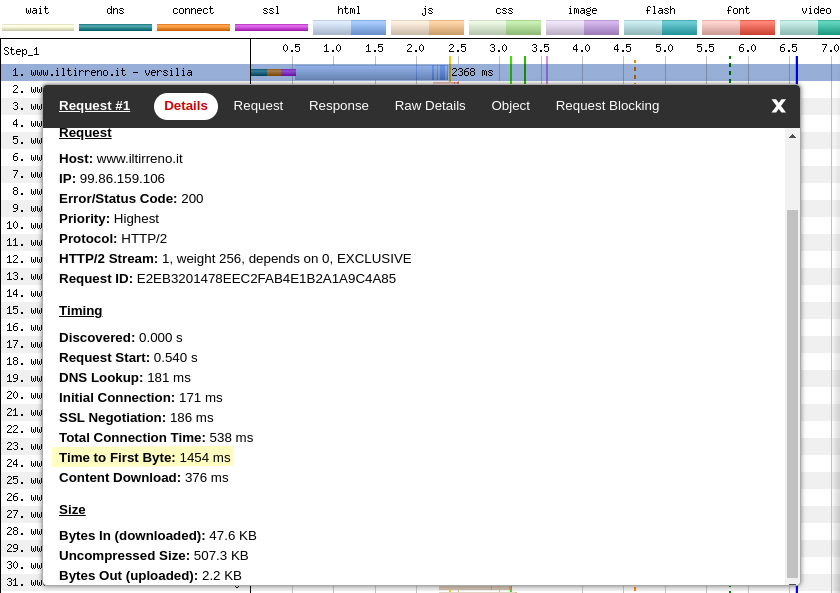
Is there anything we can do to improve this? Maybe, but without knowing the source code of the backend it’s hard to tell.
A quick, but questionable fix, would be to increase the amount of time the HTML is considered fresh in the CloudFront cache. Right now, that time is set to 60 seconds:
Cache-Control: s-maxage=60The HTML pages of a news website are dynamic, and the front page particularly so. New or updated articles will not show up until the cached version of the HTML page is expired. So we can’t cache it for too long.
But maybe 60 seconds are too few. I guess we could cache the HTML document for 5-15 minutes, at the risk of serving a stale version of the page to a few users.
Also, we could tweak stale-while-revalidate, so to serve a stale version of the page, while looking for a new version in the background.
For example the Cache-Control header below would instruct the browser to consider the HTML fresh for 300 seconds, either if it finds it in a shared cache (s-maxage) or in a private cache (max-age), and keep serving a stale version for an additional 600 seconds, while at the same time looking for a new version in the background (revalidating).
Cache-Control: max-age=300, s-maxage=300, stale-while-revalidate=600This means that in the worst case scenario a visitor would not receive the latest HTML page (generated by Next.js), and instead receive a HTML page which was cached 15 minutes ago (in CloudFront). This would be perfectly reasonable for a website that doesn’t update too many times during the day. But for a news website I’m not so sure.
Another thing we notice is that the page is not exactly light: 507.3 KB (uncompressed). Why is that? WebPageTest can’t really help to answer this question, but Chrome DevTools and a couple of other tools can.
Inspecting the HTML with Chrome DevTools
💡 — When you want to inspect a web page in Chrome DevTools, always do it in incognito mode. This way no cookies or Chrome extensions will affect the page you're examining.
If we have a look at the Elements panel in Chrome DevTools we notice a lot of <script> and <style> tags in the <head> of the HTML document.
<head>
  <!-- some meta tags, some preloads -->

  <!-- a lot of these -->
  <script defer="" src="/_next/static/chunks/some-hash.js"></script>
  <style data-emotion="css kqgxn0" data-s="">
    <!-- CSS rulesets -->
  </style>

</head>Unused CSS and JS
All those <script> tags are created by Next.js code splitting, while the <style> tags by Emotion, a CSS-in-JS library.
We can use the Coverage panel to view how much JS and CSS is actually used.
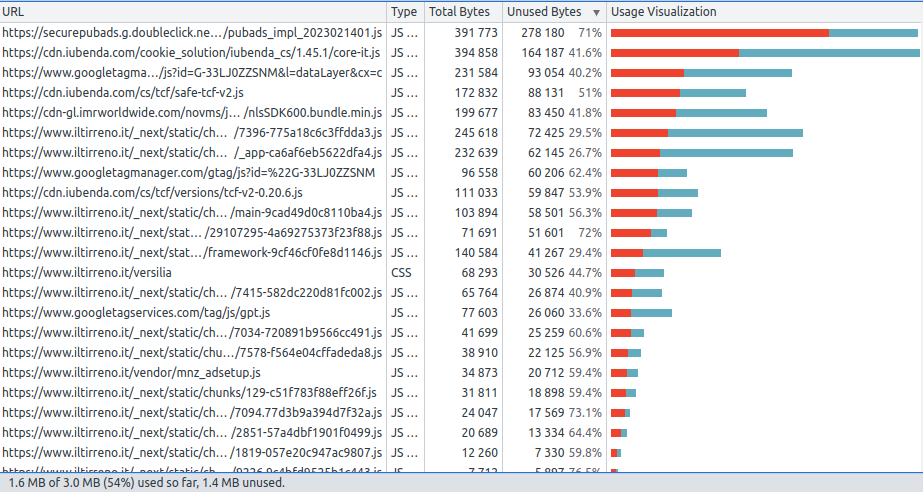
The Next.js JS code chunks have _next/static/chunks in their URL. We can see they generate some code which is not actually used, but it doesn’t seem that much. Third party scripts such as securepubads, iubenda and googletagmanager waste many more bytes.
iltirreno.it doesn’t ship source maps in its production build, so the only JavaScript code we can look at in the Sources panel in Chrome DevTools is something like this:
(self.webpackChunk_N_E = self.webpackChunk_N_E || []).push([[129], {

  21924: function(t, e, r) {
    "use strict";
    var o = r(40210)
      , n = r(55559)
      , i = n(o("String.prototype.indexOf"));
    t.exports = function(t, e) {
      var r = o(t, !!e);
      return "function" === typeof r && i(t, ".prototype.") > -1 ? n(r) : r
    }
  }

}]);
If JavaScript source maps were available, we could also visualize the code with tools such as Webpack Bundle Analyzer or Bundle Buddy, or even inspect performance traces that show us the actual JS function names.
Inlining CSS: a questionable choice
The reason we don’t see any <link> to some external stylesheet, is that there are never external stylesheets involved when working with Emotion. This is a rather questionable choice.
Inlining a small amount of CSS can be a good idea, but inlining all CSS almost definitely isn’t. One of the reasons this is bad for performance is because we can’t cache this CSS independently from the HTML. Another one is that it makes the HTML page heavier. We can see this using HTML Size Analyzer.

These violet bars tell us that almost 15% of the HTML page is in fact inlined CSS. 76KB KB (uncompressed) which we could save by using external stylesheets.
Many CSS-in-JS libraries inject <style> tags in the DOM at runtime. However, there are some that instead inject <link> tags that reference external CSS bundles. Linaria is one of these.
The price to pay for client-side hydration
In the <body> we can see the HTML for the final page (after server-side rendering and client-side hydration), some JSON data, some third-party scripts.
<body>
  <div id="__next">
    <!-- the actual page -->
  </div>

  <script id="__NEXT_DATA__" type="application/json">
    <!-- pageProps here for hydration -->
  </script>

  <!-- third-party scripts: ads, analytics, etc -->
  <script id="google-analytics-script" data-nscript="lazyOnload">
    <!-- JS code for Google Analytics -->
  </script>
</body>
The JSON contained in __NEXT_DATA__ is required by Next.js to perform client-side hydration. We can extract it by running this code in the Chrome DevTools console.
copy($('#__NEXT_DATA__').innerHTML)If we then go to JSON Size Analyzer and paste this JSON in the text box, we can see it’s quite big.
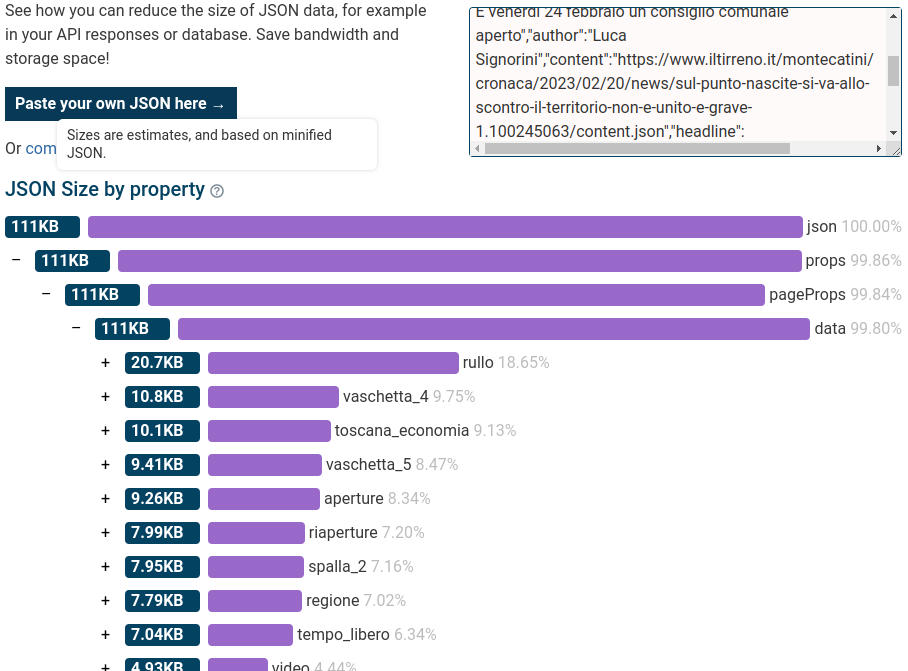
There ways to reduce the JSON data injected by Next.js, but they involve reorganizing data fetching in some ways. Not something we can do without having access to the source code.
External style sheets
As I wrote before, most of the CSS on this web page is inlined in the <head>. There are only three external stylesheets.

The first stylesheet (request 9) is hosted on www.iltirreno.it and contains only a few CSS rulesets and the @font-face rules for the fonts. It’s just 1.8KB (uncompressed). The browser takes 560ms to receive the first byte of this file, and two additional milliseconds to download it.
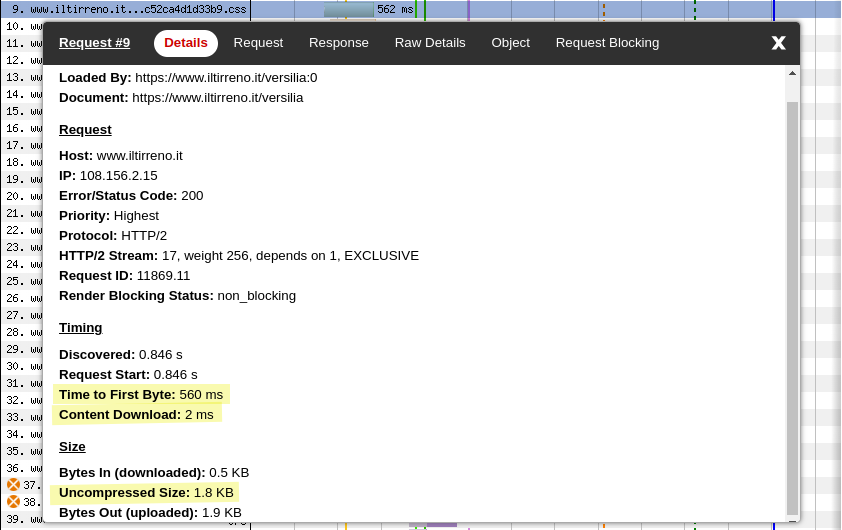
This stylesheet is named f4fc52ca4d1d33b9.css and can be found in the /_next/static/css directory. It is served with this Cache-Control header, which is probably set by Next.js.
cache-control: public, max-age=31536000, immutableThe other two stylesheets are hosted on cdnjs.cloudflare.com and contain the CSS for this carousel.
There seems to be nothing to prevent us from hosting these stylesheets on www.iltirreno.it, so we should do it.
The Cache-Control header sent alongside slick.min.css and slick-theme.min.css is the following:
cache-control: public, max-age=30672000Fonts
iltirreno.it uses several web fonts, so the browser has to download them. In the WebPageTest waterfall, we can see the HTTP requests for these fonts in red. The light red portion of the bar represents the time the browser takes to request a font, while the dark red one is the time it takes to fetch it.
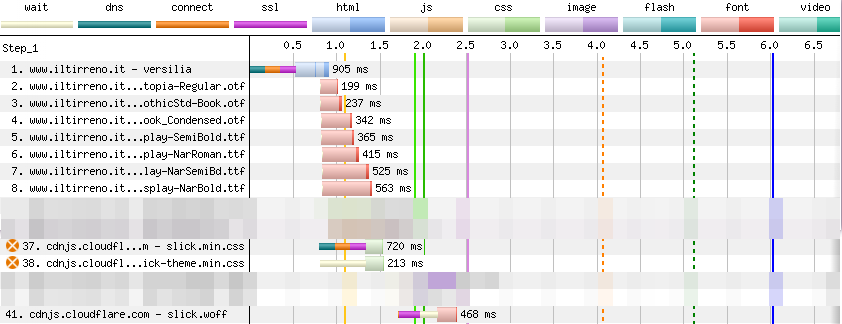
We can count eight requests for fonts. Seven of these fonts are hosted on www.iltirreno.it. One is hosted on cdnjs.cloudflare.com.
Cache-Control for fonts
Font files should never change and should be treated as immutable assets. This means we can tell the browser to cache them for a long time (tipically 31536000 seconds, i.e. one year).
In fact, this is the Cache-Control header returned with the fonts hosted on www.iltirreno.it:
cache-control: public, max-age=31536000, immutableThe Cache-Control header returned with the font hosted on cdnjs.cloudflare.com is slightly different:
cache-control: public, max-age=30672000I’m not sure why Cloudflare is not using immutable and caching the font for 355 days instead of one year. ¯\_(ツ)_/¯
Most fonts are preloaded
Web fonts must be declared using CSS @font-face rules like this:
@font-face {
  font-family: Utopia-Regular;
  src: url(/fonts/Utopia/Utopia-Regular.otf) format:("otf");
  font-display: swap;
}
This means that by default a browser has to make a chain request to download a web font: it needs to request the CSS, download it, parse the @font-face rule, find out it needs to fetch a font (e.g. Utopia-Regular.otf), and finally request the font file and download it.
The reason it doesn’t happen on this web page is that the font is preloaded thanks to a browser hint placed in the <head>.
<head>

  <link rel="preload"
        href="/fonts/Utopia/Utopia-Regular.otf"
        as="font" type="font/otf" crossorigin="anonymous" />

</head>
All seven self-hosted fonts (i.e. fonts hosted on www.iltirreno.it) are preloaded.
The font hosted on cdnjs.cloudflare.com is not preloaded. The browser finds out it has to request slick.woff (the font file) when it has finished parsing the @font-face rule contained in slick-theme.min.css. That’s why we see the request for this font much lower in the waterfall (HTTP request 41).

Font file formats
We can find three different file formats on this page: otf, ttf, woff. There is an important absence here: woff2.
Woff2 uses Brotli for compression, so we could save a few KB on each font if we convert otf and ttf fonts to woff2.
I downloaded a few .otf/.ttf files and converted them to .woff2 using this online converter. Here are the results:
ncdu 1.15.1 ~ Use the arrow keys to navigate, press ? for help
--- /home/jack/Downloads/iltirreno/fonts ---------------------------------------------------------------
   20,0 KiB [####      ]  ITC_Franklin_Gothic_Book_Condensed.otf
   12,0 KiB [##        ]  ITC_Franklin_Gothic_Book_Condensed.woff2
   48,0 KiB [##########]  PoynterOldstyleDisplay-SemiBold.ttf
   20,0 KiB [####      ]  PoynterOldstyleDisplay-SemiBold.woff2
   36,0 KiB [#######   ]  Utopia-Regular.otf
   16,0 KiB [###       ]  Utopia-Regular.woff2
The browser support for woff2 is almost universal nowadays, so there is no reason not to use this file format.
Flash Of Invisible Text (FOIT)
There are two areas on this page where text is not rendered for a while. I’m including the video once more, so you don’t have to scroll back up.
Let’s review the definition of Flash Of Invisible Text (FOIT) according to Google:
A “flash of invisible text” (FOIT) is the phenomenon in which a web page loads without the type appearing at all, before rendering to the intended typeface(s). This delay is caused by the web fonts being downloaded to the user’s device.
I had a look at the HTML in the Chrome DevTools Elements panel. There I found out that IL TIRRENO was in fact an SVG, not a text. SVG is not a web font, so I don’t think this case qualifies as FOIT.
As for the subtitle starting with Corinne, Marzia, Priscilla…, I think it could be one of these cases:
- The subtitle is present in the initial, server-side rendered HTML. This means this is a FOIT, since the text is there but nothing is rendered.
- The subtitle is not present in the initial HTML, and is added to the page after client-side hydration. This means this is not a FOIT, since in this test any one of the JS chunks gets executed after all fonts have finished downloading (see waterfall below, JS execution in pink).
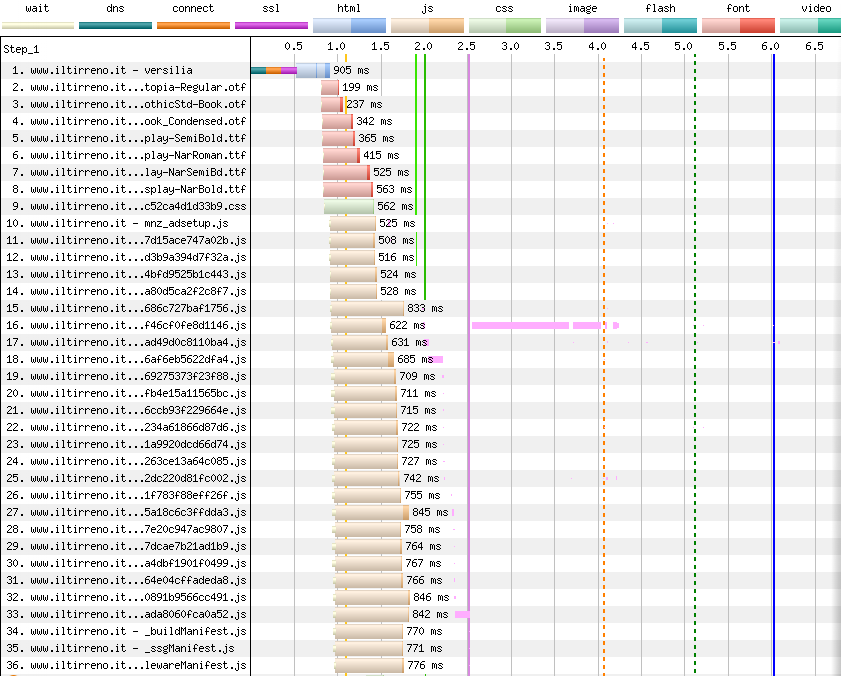
Images
Images are probably the biggest files on a web page. They are obviously important in a news website, so it makes sense to try and optimize them as much as possible.
The problem is that image optimization is hard and involves all of these steps:
- Serving the best available image format (e.g. AVIF, WebP) supported by your website visitors’ browser.
- Picking the best resolution for each device used by your website visitors. This means taking into account: screen dimensions, screen quality, device pixel ratio, CSS breakpoints.
- Defining appropriate caching policies for your images.
- Optimizing images for SEO and accessibility.
- Loading and decoding images lazily.
A lot of JPEGs
Most of the images on iltirreno.it are JPEG and are included in the page with <img> tags like this:
<img
alt=""
src="https://api-sites-prd.saegroup.abinsula.com/api/media/image/contentid/policy:1.100245629:1676969458/TR.jpg?f=detail_558&h=720&w=1280&$p$f$h$w=999f9ab"
decoding="async"
data-nimg="responsive"
style="SOME-INLINE-STYLES"
sizes="100vw"
srcset="https://api-sites-prd.saegroup.abinsula.com/api/media/image/contentid/policy:1.100245629:1676969458/TR.jpg?f=detail_558&h=720&w=1280&$p$f$h$w=999f9ab 640w,
https://api-sites-prd.saegroup.abinsula.com/api/media/image/contentid/policy:1.100245629:1676969458/TR.jpg?f=detail_558&h=720&w=1280&$p$f$h$w=999f9ab 750w,
https://api-sites-prd.saegroup.abinsula.com/api/media/image/contentid/policy:1.100245629:1676969458/TR.jpg?f=detail_558&h=720&w=1280&$p$f$h$w=999f9ab 828w,
https://api-sites-prd.saegroup.abinsula.com/api/media/image/contentid/policy:1.100245629:1676969458/TR.jpg?f=detail_558&h=720&w=1280&$p$f$h$w=999f9ab 1080w,
https://api-sites-prd.saegroup.abinsula.com/api/media/image/contentid/policy:1.100245629:1676969458/TR.jpg?f=detail_558&h=720&w=1280&$p$f$h$w=999f9ab 1200w,
https://api-sites-prd.saegroup.abinsula.com/api/media/image/contentid/policy:1.100245629:1676969458/TR.jpg?f=detail_558&h=720&w=1280&$p$f$h$w=999f9ab 1920w,
https://api-sites-prd.saegroup.abinsula.com/api/media/image/contentid/policy:1.100245629:1676969458/TR.jpg?f=detail_558&h=720&w=1280&$p$f$h$w=999f9ab 2048w,
https://api-sites-prd.saegroup.abinsula.com/api/media/image/contentid/policy:1.100245629:1676969458/TR.jpg?f=detail_558&h=720&w=1280&$p$f$h$w=999f9ab 3840w"
>We can notice a few things about this <img> tag:
- It has an empty
altattribute. This means the image is not accessible. It offers no alternative text that screen readers can read aloud to blind users. - The
data-nimgattribute seems to suggest that the website is using the<Image>component provided by Next.js. More precisely, since WebPageTest detected a version of Next.js previous to 13, we could speculate this is the next/legacy/image component. - The image is decoded asynchronously
- There is no
loading="lazy". This means the browser loads this image eagerly. This is fine for images that are in the viewport, but images below the viewport could be lazily loaded. See here for today’s browser support for loading=“lazy”. - There is a
srcsetattribute, but the URL specified for each viewport width (e.g. 750w, 3840w) is the same (yep, double check those query strings). Also, no media queries are specified in thesizesattribute. This means resolution switching is actually not done: the browser will always load the same image, regardless of the viewport width.
Most images on this web page are JPEG and are served by a Strapi server hosted at api-sites-prd.saegroup.abinsula.com. We know this because if we have a look at the Chrome DevTools Network panel (or at REDbot), we see that the HTTP request for this image returns this custom header:
x-powered-by: Strapi <strapi.io>Another response header returned by the image service is Content-Security-Policy. Sending a CSP for other than HTML is probably not necessary. I think it is Strapi the one sending it.
A few data URLs
A few other images on this website are data URLs and are included in the HTML using a strange <msdiv> tag. My guess is that these data URLs are generated by the streaming media service used by iltirreno.it.
<msdiv
class="player-poster"
msp-id="SOME-ID"
style="SOME-INLINE-STYLES"
background-image: "url("data:image/jpeg;base64,DATA-URI-HERE);"
>
</msdiv>This <msdiv> tag appears only in pages that have one or more videos, and since front pages like www.iltirreno.it/versilia or www.iltirreno.it/firenze change every day (often multiple times a day), we might find this tag today, and not find it tomorrow.
Data URLs that embed images in the HTML have several issues:
- The image cannot be cached independently from the HTML.
- The data URL increases the page size. Also, the image is just Base64-encoded, not compressed.
- Data URL in general pose some security concerns.
No Low Quality Image Placeholders (LQIP)
Take a look at the video below, that I recorded after having enabled Paint flashing (green) and Layout Shift Regions (blue) in Chrome DevTools.
As you can see, there is a small layout shift in the top right area, while images trigger only repaints, no layout shifts. This is good news.
But no image is displayed on the screen until it is fully loaded. Images suddenly appear on the page, replacing the blank space that was previously there.
This is not the best user experience, especially when the connectivity isn’t great and the user has to stare at the screen for a few seconds until the browser has finished loading the images.
An improvement would be to show a Low Quality Image Placeholder (LQIP) initially, and then swap it for the image when the image is ready.
Consent banner
When a user visits iltirreno.it, their browser sets some cookies for analytics and ads. In order to comply with the ePrivacy Directive, the website must display a consent banner to its visitors. The banner looks like this:

On iltirreno.it this banner is generated by the script iubenda_cs.js. In fact, if we block that script using the Network request blocking tab in Chrome DevTools, the banner does not appear at all.

In performance audits, consent banners can be problematic for various reasons:
- They are often the biggest element in the page, so they can falsify Largest Contentful Paint (LCP).
- They can cause layout shifts (aka reflows).
- They might block HTTP requests until the banner is closed or dismissed (i.e. they delay the browser load event).
We can use the ChromeDevTools Rendering tab to understand when this banner triggers a repaint, and whether it causes a layout shift. We can do this by enabling the checkboxes Paint flashing and Layout Shift Regions in Chrome DevTools.

As we can see from the video below (I recorded this video on a different day, but the banner is the same), the banner pops up in the page a few instant after navigation. The browser needs to render it, so this causes a paint (see the green flash). Luckily, this causes no layout shifts (no blue flashes associated with the banner).
Accessing cookies and Local Storage with a Chrome snippet
When a website visitor accepts or refuses the cookie policy, consent banners store this choice in a cookie or in localStorage. We can find out which cookie is used to track the user’s consent by examining the Application tab in Chrome DevTools.
If we navigate to www.iltirreno.it/versilia, we can see that the browser sets two cookies for Google Analytics.

If we click Accetta (i.e. accept) in the consent banner, a few other cookies are set.

The cookie we are interested in is called euconsent-v2. This is the one that stores the user’s consent, and it’s set by the iubenda_cs.js script.
Since euconsent-v2 is set by many other consent banners, I created a Chrome snippet to extract it. The code below is based on a script that Andy Davies describes in his article Bypassing Cookie Consent Banners in Lighthouse and WebPageTest.
// Bypass consent banner. Useful for WebPageTest
// Adapted from this Andy Davies' script
// https://github.com/andydavies/webpagetest-cookie-consent-scripts/blob/main/scripts/quantcast-choice.md

// 1. visit a website (e.g. https://www.iltirreno.it/)
// 2. click accept/reject in the consent banner
// 3. run this Chrome snippet. It will generate a JS script and it will copy it to the clipboard
// 4. go to WebPageTest https://www.webpagetest.org/
// 5. In WebPageTest Advanced Configuration, paste the generated script into the Inject Script text box

// We use let instead of const so we can run this Chrome snippet multiple times on the same page.
let local_storage_keys = [
  'noniabvendorconsent',

  // these 2 define storage duration
  'ope_fpid',
  'ope_uid'
]

let local_storage_entries = local_storage_keys.map(key => {
  return { key, value: localStorage.getItem(key) }
})

let local_storage_snippets = local_storage_entries.map(e => {
  if (e.value) {
    return `localStorage.setItem('${e.key}', '${e.value}');`
  } else {
    return ''
  }
}).filter(s => s !== '')

let cookies = document.cookie.split('; ').filter(s => {
  return s.startsWith('_iub_cs') || s.startsWith('euconsent-v2')
})

let cookie_snippets = cookies.map(cookie => {
  return `document.cookie = '${cookie};';`
})

// Generate JS script and copy it to the system clipboard
let snippets = [...local_storage_snippets, ...cookie_snippets]
let output = snippets.join('\n')
copy(output)

// Be sure to click accept/reject in the consent banner before running this snippet
console.group('bypass consent banner')
console.log(`Instructions:`)
console.log(`1. go to WebPageTest https://www.webpagetest.org/`)
console.log(`2. enter ${document.URL} as the Website URL to test`)
console.log(`3. go to Advanced > Inject Script, then paste the generated JS script (it's already copied to the clipboard)`)
console.groupEnd('bypass consent banner')Bypassing the consent banner in WebPageTest
If we click accept in the consent banner, run the Chrome snippet, copy the JavaScript code into the WebPageTest Inject Script text box and launch a new audit, we can see that the consent banner no longer appears in the video.
But we notice an issue: a layout shift caused by the top ad.
This is also apparent from the Filmstrip View. A dashed yellow frame signals us that a layout shift occurred.
Notice also how the percentage drops from 95% to 84%, and then to 91%. That’s the Visual Progress of the page. The ad does not completely fills the space reserved to it.
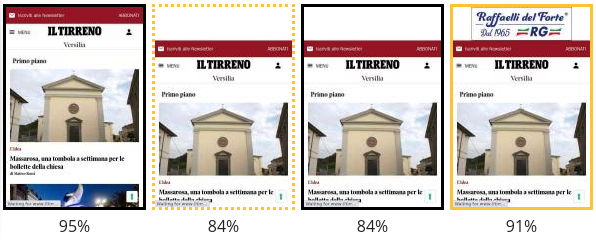
A visit where no consent banner is shown is one of the possible scenarios when visiting most news websites for the second time. I can think of these situations for a second-time visitor:
- They are subscribed to the newspaper, and they have accepted/rejected the website policy: cookies and Local Storage are set, no consent banner appears, no ads appear.
- They are not subscribed to the newspaper, and they have accepted/rejected the website policy: cookies and Local Storage are set, no consent banner appears, some ads appear.
- They are subscribed to the newspaper, but they have not accepted/rejected the website policy: cookies and Local Storage are not set, the consent banner keeps showing up, no ads appear.
- They are not subscribed to the newspaper, but they have not accepted/rejected the website policy: cookies and Local Storage are not set, the consent banner keeps showing up, no ads appear.
Scenarios 1 and 2 are far more likely to occurr, so they are more important to test. But 3 and 4 happen from time to time. I know it’s strange to keep visiting a website without ever dismissing the consent banner. But I’ve seen it done, so we can’t rule it out.
Third party requests
When a user visits iltirreno.it and they have not yet expressed their consent, the browser makes roughly 60 requests. A few of them are first party requests, namely they fetch resources from the website itself (e.g. JS files generated by Next.js, web fonts). The rest are third party requests.
When a user has already given their consent and visits the website again, the browser now makes roughly 140 requests.
Why is that?
It’s because only after consent is freely given the website can execute those third party scripts that process the user’s personal data. In fact, in the European Data Protection Board (EDPB) Guidelines 05/2020 on consent under Regulation 2016/679 we can read the following:
[…] consent must always be obtained before the controller starts processing personal data
for which consent is needed.
A WebPageTest Waterfall View with 140 requests would be long to include, but there is another one which is equally effective in showcasing this fact: the Connection View.
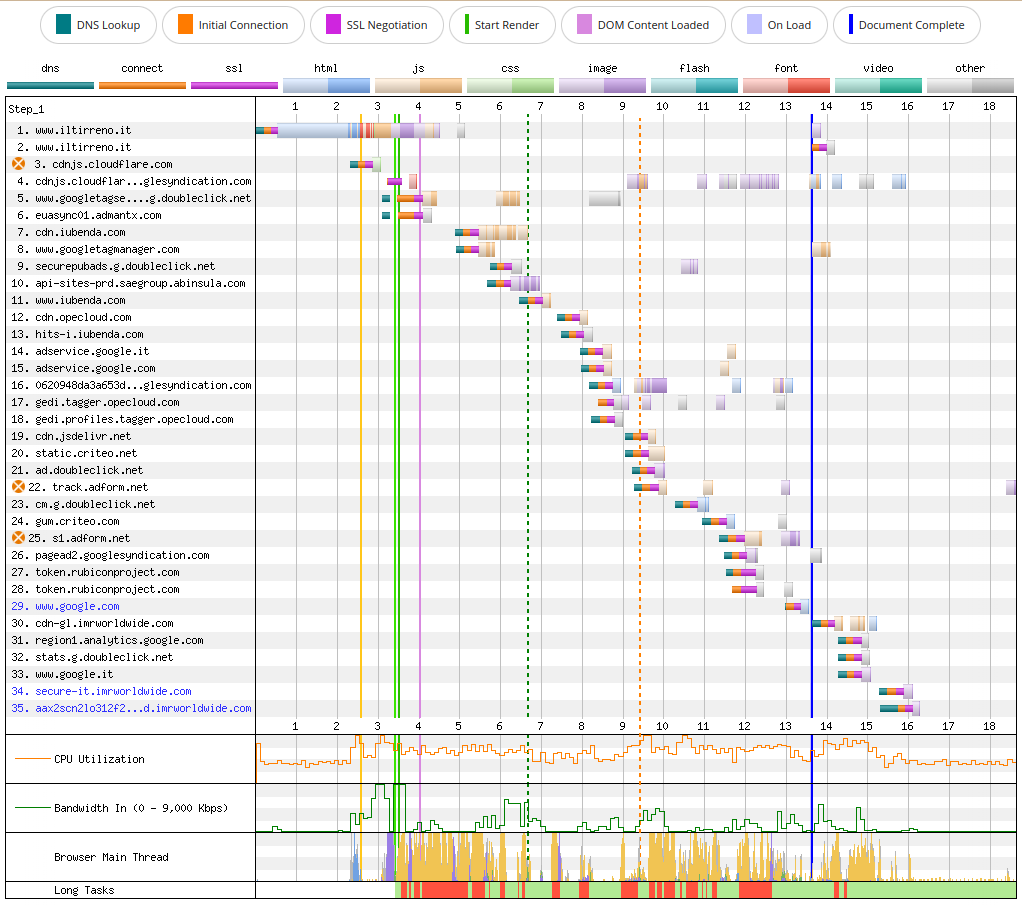
As we can see from the image above, most of the resources actually needed to render useful content on the screen take less than 7 seconds to load. I’m talking about the HTML, CSS and JS hosted on www.iltirreno.it (request 1), and the images hosted on api-sites-prd.saegroup.abinsula.com (request 10). Almost all other resources are small files (Bandwidth In stays rather low), but they cause the execution of a lot of JavaScript (CPU Utilization stays high and they cause many long tasks in the browser’s main thread).
We can also use the Performance Insights panel in Chrome DevTools to understand where this JS comes from, and when it is executed.
But the most useful tool is probably Request Mapper, that takes the WebPageTest Test ID as an input (e.g. 230223_BiDcV9_GGY) and generates a force-directed graph of all requests.
What if we block all third party requests?
The impact of third party requests on the web performance of iltirreno.it is apparent if we block them.
We can configure WebPageTest to block requests by URL or domain. We then launch a test and compare the results against a baseline where we don’t block any request.
First, we have to identify all third party requests. There are several ways to do it. I’ll show you one that uses xsv. A similar tool you can use for this task is Miller.
From the WebPageTest test results of the baseline (no requests blocked), click Export and then Download Request CSV.

Rename the CSV to requests.csv, so we have less typing to do.
Each row in requests.csv represents a request. We can partition these requests by their host column, and create a CSV file for each host. We will store these CSV files in a folder we call request-hosts.
xsv partition "host" "request-hosts" requests.csvWe want to keep all requests to www.iltirreno.it and to api-sites-prd-saegroup.abinsula.com (the website’s image service).
mv request-hosts/wwwiltirrenoit.csv .
mv request-hosts/apisitesprdsaegroupabinsulacom.csv .
We create a single CSV file containing all requests to block. For this we can use a combination of lsd, xargs and xsv.
cd request-hosts
lsd | xargs --verbose xsv cat rows -o third-parties.csv
We then select the host column from third-parties.csv and create a space-separated list of hosts.
xsv select 'host' third-parties.csv | sort | uniq | sd '\n' ' ' > hosts-to-block.txtThe hosts-to-block.txt file should look like this:
0620948da3a653d1d34a6c8ef45dd69a.safeframe.googlesyndication.com 338db68053e8c4561c8b22bf7e1a3ce2.safeframe.googlesyndication.com 39dc14b003a17f497df29ffc64355b51.safeframe.googlesyndication.com 98a701c2a89109232cfbba6f0b43d7d1.safeframe.googlesyndication.com aax2scn2lo312f2xv6kn54eiqz9sr1677185495.nuid.imrworldwide.com ad.doubleclick.net adservice.google.com adservice.google.it cdn-gl.imrworldwide.com cdn.iubenda.com cdnjs.cloudflare.com cdn.jsdelivr.net cdn.opecloud.com cm.g.doubleclick.net euasync01.admantx.com gedi.profiles.tagger.opecloud.com gedi.tagger.opecloud.com gum.criteo.com hits-i.iubenda.com host pagead2.googlesyndication.com region1.analytics.google.com s1.adform.net secure-it.imrworldwide.com securepubads.g.doubleclick.net sohsjmkfg3km8ds8rwmqgbqz03pbn1677185540.nuid.imrworldwide.com static.criteo.net stats.g.doubleclick.net tagger.opecloud.com token.rubiconproject.com tpc.googlesyndication.com track.adform.net www.google.com www.google.it www.googletagmanager.com www.googletagservices.com www.iubenda.comWe copy this space-separated list of hosts, go to WebPageTest, Advanced Configuration > Block, and paste it the Block Domains text box. We can then launch the test.
ℹ️ — There is no need to set the euconsent-v2 cookie when we block third party requests. It's the script iubenda_cs.js the one creating the consent banner. But iubenda_cs.js is hosted on cdn.iubenda.com, which we are blocking. This means no consent banner will appear.
In WebPageTest we can select two tests and compare them.
Here down below, in blue, we can see the test in which all 3rd party requests are blocked. In red, the baseline where no requests are blocked.
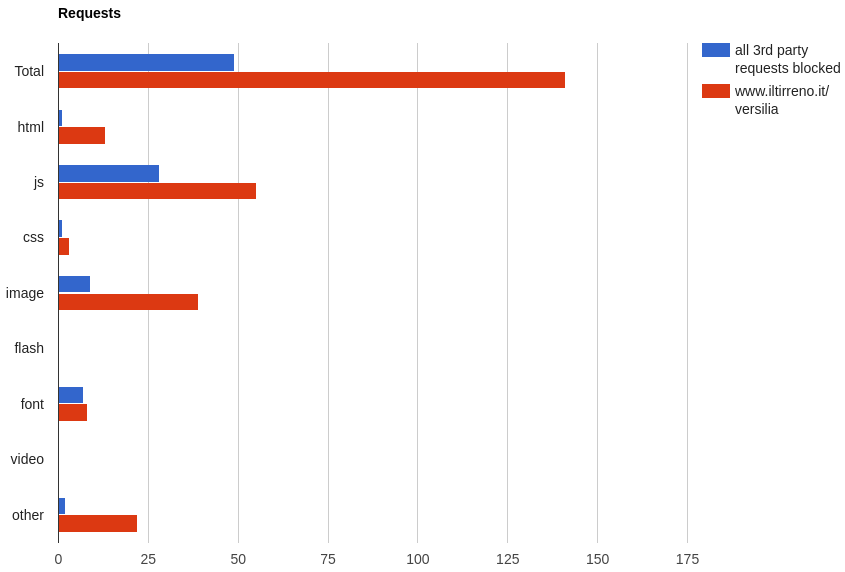
We can notice a few things:
- When 3rd parties are blocked, the browser makes only 49 requests instead of 141.
- When 3rd parties are not blocked, there are 13 HTML entries. One is the main HTML document. Others are mostly
<iframe>s created by ads and trackers. - There is almost double the JavaScript when 3rd parties are not blocked.
- There are many more images when 3rd parties are not blocked. I suspect these ones are 1-pixel images used for tracking.
Overall, the browser has to download roughly 40% more bytes when third parties are not blocked. And it has 171% more JavaScript to download, parse, execute.
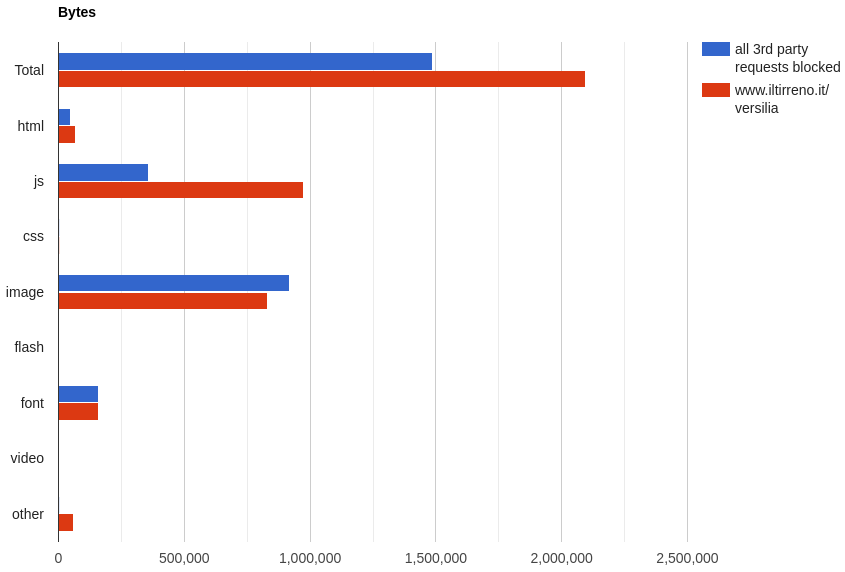
The impact of JavaScript is apparent when we look at CPU Utilization, Bandwidth In, Browser Main Thread, Long Tasks.
Here are the charts for the baseline:

And here are the charts when third party requests are blocked:

Does this mean that we should remove all third party requests? Of course not. Newspapers make money selling advertising space, either on their print edition, or the digital one. Removing all ads is technically feasible, but it would be economically impossible. What we could do is carrying out a cost-benefit analysis on each third party, and decide whether it justifies its cost in terms of browser performance.
ℹ️ — The Pew Research Center reports that in 2020 almost 40% of the advertising revenue of US newspapers (published by a publicly traded company) came from digital ads (source). This percentage might be different for an Italian newspaper though, I couldn't find any data on this.
Prototyping changes without touching the source code
A typical OODA loop when trying to improve the performance of a website could be something like this:
- Measure the website performance in a staging environment, to establish a baseline.
- Come up with a hypothesis.
- Modify the source code of the website.
- Deploy the changes to a staging environment.
- Measure the website performance in a staging environment, to evaluate the effect of changes.
- Accept the changes or roll them back.
This is a very slow process. We could save some time if we deploy directly to production. But this of course introduces risks.
It would be nice if we could quickly prototype our changes without touching the source code of the website and without messing with the production environment. Well, turns out we can: we can place a proxy server between the browser and the website. The proxy server in question can be a worker on Cloudflare Workers.
With this approach the steps of the process are basically the same, but they happen on the worker, not on the staging/production environment:
- Measure the website performance on Cloudflare Workers, to establish a baseline.
- Come up with a hypothesis.
- Modify the source code of the worker.
- Deploy the changes to Cloudflare Workers.
- Measure the website performance on Cloudflare Workers, to evaluate the effect of changes.
- Accept the changes or roll them back.
So, what code should we write in the worker? We should write code that fetches the original website, adds/removes/alters the HTTP response headers, and adds/removes/alters the HTML. We can do this using the Cloudflare Workers HTMLRewriter API.
Performance Proxy
This blog post is already much longer than I had anticipated, so I won’t include any code for the worker here. Instead, I’ll use Performance Proxy by Simon Hearne to showcase a few things we can do with HTMLRewriter.
First of all, we need to establish a new baseline. When we put a proxy between the browser and the website, the resources (HTML, CSS, JS, images, etc.) are served by the proxy. We cannot compare a WebPageTest test result obtained when the website is served by the original infrastructure (AWS CloudFront + nginx + Node.js) with a WebPageTest test result obtained when the website is served by this proxy. It would be an apples to oranges comparison.
So, before trying out any optimization, we enter https://www.iltirreno.it/versilia as the Target URL in Performance Proxy, and leave everything else blank.
Performance Proxy gives us a Test URL that we can enter directly in the browser’s address bar. This URL is the website proxied by Cloudflare.
https://www_iltirreno_it.perfproxy.com/versiliaPerformance Proxy also gives us a WebPageTest Script containing a few istructions written in the WebPageTest scripting DSL. We can copy these instructions and paste them in WebPageTest.
overrideHost www.iltirreno.it www_iltirreno_it.perfproxy.com
blockDomains <space-separated-list-of-domains-to-block>
navigate https://www.iltirreno.it/versilia
Performance Proxy, Request Blocking, Block Hosts containing.
stiamo passando da un proxy. E poi Cloudflare gia’ di suo potrebbe migliorare la performance.
Before launching the test in WebPageTest, give this WebPageTest audit a Label, such as cf-no-third-parties (where cf stands for Cloudflare).
And also Request Blocking, Block Hosts containing.
Then in Advanced Configuration > Script. WebPageTest DSL, not JS.
No need to enter the website URL, since the navigate instruction will visit the page.
Adding response headers
One of the things we can do with the HTMLRewriter API is adding some response headers. For example I added a Server-Timing header:
Server-Timing: request-validation;desc="Request validation";dur=150, cms;desc="Fetch articles from CMS";dur=300, ssr;desc="Next.js SSR";dur=750,analytics;desc="Send data to analytics";dur=180,monitoring;desc="Send data to monitoring";dur=200Note that the timestamps I included are completely fake. In reality these timestamps would be computed on the backend and would reflect what is actually going on there.
The cool thing about Server-Timing is that the measurements it contains can be visualized in the Chrome DevTools Network panel (select the main HTML document, then the Timing tab to see all headers, Server-Timing included).
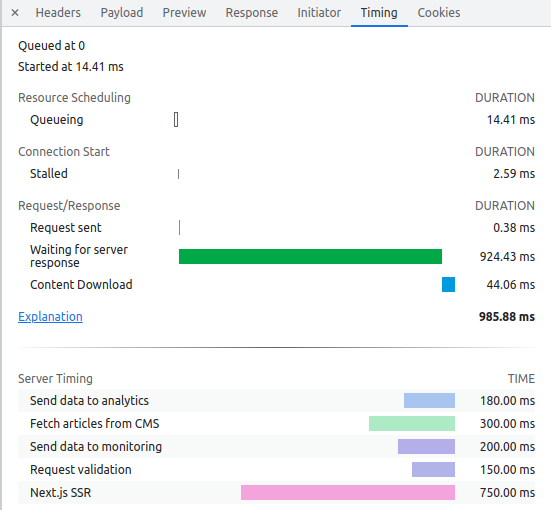
Adding resource hints
We can add a preconnect hint for the image service (Strapi). If the browser doesn’t decide to ignore the hint, it performs DNS lookup + TCP connection + TLS handshake towards that host.
We can also add a dns-prefetch hint as a “fallback”, just in case preconnect is not supported (dns-prefetch only performs the DNS lookup, so calling it fallback of preconnect is a bit of a stretch).
In Performance Proxy, we enter this in the text box that says Top of <head>:
<link rel="preconnect"
      href="https://api-sites-prd.saegroup.abinsula.com"
      crossorigin>

<link rel="dns-prefetch"
      href="https://api-sites-prd.saegroup.abinsula.com">
We could also add a few other resource hints for Google Tag Manager:
<link rel="preconnect"
      href="https://www.googletagmanager.com"
      crossorigin>

<link rel="dns-prefetch"
      href="https://www.googletagmanager.com">

<link rel="preconnect"
      href="https://www.googletagservices.com"
      crossorigin>

<link rel="dns-prefetch"
href="https://www.googletagservices.com">Adding timestamps using the User Timing API
Another thing we could do is to use the performance.mark() method of the User Timing API to track when a certain event occurs. And the performance.measure() method to measure the time between two performance marks.
For example, in Performance Proxy we can insert this code at the top of <head>:
<script>
  performance.mark('head-begin')
</script>
This code at the bottom of <head>:
<script>
  performance.mark('head-end')
</script>

<script>
  performance.measure(
    'head-processing',
    'head-begin',
    'head-end'
  )
</script>
This at the top of <body>:
<script>
  performance.mark('body-begin')
</script>
And this at the bottom of <body>:
<script>
  performance.mark('body-end')
</script>

<script>
  performance.measure(
    'body-processing',
    'body-begin',
    'body-end'
  )
</script>
When we add these performance marks, a WebPageTest Waterfall View will show them in purple.

Summing up
Overall, the main issue of www.iltirreno.it/versilia is represented by the many third party scripts on the page. They are the most detrimental to page performance, even before accepting the consent banner (thus adding a few more third party scripts to load and execute).
To improve the situation we could put all third party scripts in Google Tag Manager (GTM) and load them using a Window Loaded trigger.
In alternative, we could execute them in a web worker. For example using partytown (there is already an integration for Next.js). This would translate into less work to do for the main thread.
But even before that, we could perform a cost-benefit analysis about each third party script used in the page and ask ourselved these questions: How much does it cost in term of performance? How much revenue does it generate for the website?
There are several other things we could try:
- Self-host the slick carousel (both the CSS and the
slick.wofffont) instead of leaving it oncdnjs.cloudflare.com. - Review what data is returned by
getServerSideProps()and try decreasing what gets injected into the__NEXT_DATA__JSON script. Maybe inline some page data into the HTML. - Use tools like Bundle Buddy and Webpack Bundle Analyzer in combination with the Chrome DevTools Coverage panel to identify unused JavaScript and reduce the JS code chunks.
- Use a service worker to cache third party scripts and other assets.
- Use AVIF or WebP as the image format, instead of JPEG.
- Configure resolution switching correctly, so big images will be downloaded only when viewing the website on wide viewports (i.e. desktops, not mobile phones).
- Use an image CDN like Cloudinary to serve images optimized for each device.
- Add a
preconnectand adns-prefetchin the<head>to improve the first connection to the image service (Strapi or Cloudinary). - Use Woff2 for web fonts.
- Avoid inlining all the CSS in the
<head>. Maybe keep inlining some critical CSS.
Thanks to Tim Kadlec and Tim Vereecke for suggestions on how to interpret a few WebPageTest test results.